题目内容
(请给出正确答案)
题目内容
(请给出正确答案)
[主观题]
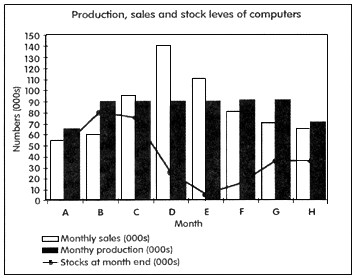
&8226;Look at the chart below. It shows the sales, production and stock levels of a comput
er manufacturing company over an eight-month period.
&8226;Using the information from the bar chart, write a short report describing all the changes that took place during the eight months.
&8226;Write 120—140 words on the separate answer paper provided.
暂无答案
 如果结果不匹配,请 联系老师 获取答案

 更多“&8226;Look at the chart below.…”相关的问题